The Kano model
Assessing Product Features based on Customer Satisfaction

The Kano models helps designers and developers of (digital) products to ensure they don't develop products that entirely miss desires and wishes of customers. A Kano analysis shows the interconnection between a product's characteristics and the resulting customer satisfaction. The results of a Kano survey don't depend on theoretical models or the assumptions of developers but on surveys answered by real users. On top of that Kano doesn't only differentiate between positive or negative effects on customer satisfaction but considers five different kinds of relationship between the product and customers' satisfaction. Possible areas of application are:
  • User-centric requirements analysis
  • Analysis of customers' opinions
  • Assessment of new product ideas
  • Feature prioritization for further development
  • Decision-making aid in trade-off situations
In the following we will explain the model as well as how to conduct and analyze a Kano study, so that product managers, UX researchers, and other interested parties can inform themselves extensively about this method and add it to their sets of tools. Tips within the blue boxes are based on our own experiences with the Kano model.

The model

Kano's model [1] points out the connection between customer satisfaction (y-axis) and the feature's functionality (x-axis). In this context "feature functionality" can be understood as the degree to which the feature does its job and fulfills its intended purpose. For example the functionality of the feature "battery life" is the better the longer a device runs starting with a completely charged battery. Compared to other common models describing customer satisfaction, the Kano model doesn't propose that a certain characteristic of a product influences the customers' satisfaction either in a linear positive or in a linear negative way. Because of this, predictions concerning questions such as where to start in order to gain and retain customers are considerably more precise. Kano also emphasizes that the improvement of any given feature doesn't necessarily improve the customer satisfaction.

Feature categories

The Kano method distinguishes between five ways in which feature functionality influences customer satisfaction. As depicted in the graph above, some features influence the customer satisfaction in a positive way, some in a negative way and others not at all. However there are also features that can only lead to less dissatisfaction but can never make customers happy or delighted and those that make customers more or less happy, but will never lead to dissatisfaction.
Must-be
These features are the customers' fundamental requirements. Missing Must-be features decrease customer satisfaction.
The breaks of a car (you better have them)
Performance
These features are characterized by a direct relationship between improved functionality and customer satisfaction. The better they perform, the happier your customers will be.
Mileage of a car (the more the better)
Attractive
Customers don't expect these features. However, when presented they cause a positive reaction bordering on delight.
A car's extra equipment
Indifferent
The presence of absence of these features doesn't really change customer's reaction to the product – neither in a positive, nor in a negative way.
A car's sunroof (at least for some people)
Reverse
Customers are not interested in these features and are happy, when they're absent. They might also actually want the opposite feature.
Automatic location sharing

Decay of delight

Beside the multilayered take on customer satisfaction, the Kano model also takes into account that these dependencies aren't fixed and can change over time. Kano predicts a decay of delight on the part of the customer. Having categorized a feature as "attractive" in one Kano survey doesn't guarantee that this feature will continue to delight customers for years. The predicted decay of delight is based on the fact, that customers become used to features very quickly. Imagine using a product that has an especially useful or innovative feature. The first few times you use it, you will be positively surprised and maybe even delighted. But after some time you will get used to this feature – what was once an Attractive feature becomes a Performance feature. In the end you will have become so accustomed to this feature that you would only be disappointed by its absence. The feature that was once attractive has become a Must-be feature over time. Examples are, e.g., airbags in cars or touch screens of mobile devices.
Hint: Monitor changes
If you want to stay up to date on features transitioning from one category to another, you should run Kano surveys with these features with a certain frequency (every couple months).

Running a Kano study
From the definition of features to running a survey

Before you can run a Kano study, the features that will be evaluated have to be defined. Features can be determined using a number of different methods (e.g. Design-Thinking workshops; in-depth analysis of the problems, the product is supposed to solve; analysis of the context of use and related problems, etc.). Subsequently the target group and their defining characteristics should be assessed. Sometimes it is known before the study begins, that the target group contains various clusters. In those cases the groups should be segmented accordingly. Finally the product that is the study's focus needs to be described briefly (e.g. "Sneakers for marathon runners") and each feature that is evaluated should be explained as well. It's important to explain features in a way that is is easily comprehensible for customers (e.g. "The shoe is water resistant" versus "The surface material has been nanotechnologically coated").
Hint: Limit your amount of features
Oftentimes one might try to assess as many features as possible in order to prioritize accordingly. However one study should be limited to no more than ten features. Usually the quality of the data gathered drops significantly with the length of the questionnaire.

The Kano questionnaire

The Kano method uses a standardized questionnaire that measures participants' opinions in an implicit way. This means that participants aren't asked directly which features they expect a product to have or what would delight them. Instead the questionnaire uses a pair of questions the evaluate the individual features. The functional question assesses the customers' reaction to the features existence. The dysfunctional question determines users reaction to the feature's absence. There are five ways in which participants can answer the functional and the dysfunctional question: "I like it", "I expect it", "I am neutral", "I can tolerate it", and "I dislike it".
Hint: Continuity of the Kano scale
Unlike the Likert scale—which is commonly used when assessing opinions—the answer options a Kano study provides are not to be seen as a continuous scale. Answers only mirror the category of features, not their worth.
(Feature is absent)
(Feature is present)
QuestionableAttractiveAttractiveAttractivePerformance
ReverseQuestionableIndifferentIndifferentMust-be
ReverseIndifferentIndifferentIndifferentMust-be
ReverseIndifferentIndifferentQuestionableMust-be
ReverseReverseReverseReverseQuestionable

Assigning a category

When it comes to assigning the features to their respective categories, one of multiple practices can be used. The most commonly used one is the strategy described by Walden [2]. To figure out which feature belongs to which category the table below is used. A feature is always assigned the category that can be found at the intersection between the functional answer (row) and the dysfunctional answer (column). While Walden uses a slightly different version of the evaluation table (which only uses the category "questionable" in the very corners of the table), Pouliot's [3] modified version of the evaluation table is more popular nowadays.

The category "questionable"

Most authors and experts agree that the category "questionable" is not a real category which can be assigned to features. It actually points to mistakes that have been made in the design or execution of the study. Features are assigned the category "questionable" when the respondents answer the functional and the dysfunctional question in a contradictory way. While the data gathered with quantitative questionnaires tends to contain some outliers or unusual results, great amounts of contradicting answers can be a sign of unclear feature descriptions.

Pointers for reliable results

If you know that your target group is split into some kind of subgroups, you should always make sure to analyze subgroups independently of each other. Different user groups can have a very different attitude towards the same feature [4]. In order to avoid misunderstandings, features should be described as clearly as possible. Under certain circumstances it can be beneficial to show pictures or even videos of prototypes. The Kano analysis is a quantitative method. Therefore it should be run with at least 40 participants to make statistically sound results possible. Evaluating Kano studies isn't complicated per se. Theoretically all you need is the data you gathered and a sheet of paper or a simple spreadsheet tool. However the evaluation gets time consuming very quickly—especially when the number of participants is high. That's why using tools like Kano+ can save a lot of time and manual work.

Analyzing a Kano study

Assigning every feature one of the categories is the first step towards evaluating a Kano study. Every feature is assigned one distinct category based on every single respondent's answer. There are multiple ways to do this that have evolved over the past years. The most common ones are the discrete analysis and the continuous analysis which are described in more detail below.

Discrete analysis

The discrete analysis simply assigns every feature one of the five categories. A feature belongs to the one category that the majority of participants consider it a part of. While this is the original method there is one major point of criticism: Because of the very black and white way in which features are sorted, information is lost. After assigning categories to the features, you can't discern whether 27 or 48 out of 50 respondents assigned that category to the feature. The table below shows an example of a discrete analysis for the product "smartphone" and its features.
Hint: Segment your target groups
Sometimes features are assigned two different categories (e.g. 42 respondents' answers resulted in the category "attractive" and 38 resulted in "must-have"). If this happens you should consider whether your target group contains hidden structures you didn't identify. You may want to split your group into subgroups.

Fong test

The Fong test can answer the question whether or not your results are statistically significant. In order to check for significance, Fong's test uses the following formula: 
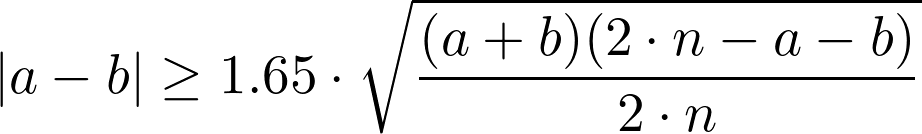
a describes the feature's occurrences in in the most frequent category, b describes the occurences in the category with the second highest frequency, n is the overall number of respondents surveyed. If the statement made by Fong's test (i.e. the inequation) is true, you can assume the assignment of the category is not based on random variation of the gathered data. The test is calculated independently for every feature.

Continuous analysis

The continuous analysis was first proposed by DuMouchel [6]. It solves the critique concerning the loss of information during the discrete analysis and tries to pay attention to all of the available information. It visualizes the assignment of categories and can show subtle tendencies in the data. For example, one can quickly and intuitively assess from the example graph whether a given feature lies between two categories (e.g. #4 and #3) or whether it can be categorized unambiguously (e.g. #5 and #9).
FunctionalDysfunctionalValue
I dislike itI like it-2
I can tolerate itI expect it-1
I am neutralI am neutral0
I expect itI can tolerate it2
I like itI dislike it4
While the conventional discrete analysis doesn't assign certain values to each feature (cf. hint "Continuity of the Kano scale" ), the continuous analysis uses a scale to evaluate the Kano survey's results. In order to categorize features, the continuous analysis assigns every answer to the dysfunctional and functional questions a numeric value. Then the averages are used to determine the resulting category. DuMouchel doesn't use a linear scale here, but gives positive answers (positive reactions to the presence of a feature and negative reactions to its absence) a higher value. During the interpretation of the continuous analysis the focus lies mainly on the positive portion of the graph. E.g., features that are assigned the category "reverse" are are placed within the negative part and thus lie outside of the visible graph.

Miscellaneous

Origin of the model

The Kano model of customer satisfaction was developed by Noriaki Kano. Kano worked as professor at the Tokyo University of Science for most of his life. His primary area of research is quality management—his research concerning this topic has won multiple international awards. The basis for the Kano model of customer satisfaction was set with his colleagues in the late 70s and early 80s. His assumption that working on and improving random features of a product doesn't necessarily improve the product or improve customer satisfaction is the major contribution of the model. Kano introduced the notion that different kinds of features influence customers in a more or less dramatic way. The realization that improving any given feature doesn't necessarily make a product more attractive to the customers, helps designers make decision during product development to this day.
Noriaki Kano
(credits: Mind The Product)

Prioritize features with Kano

Assessing product features using the Kano method helps you predict whether implenting certein new or improving existing features influences your users' satisfaction. This prediction is founded on a sound scientific theory. However companies usually aim to prioritize planned features unambiguously. This raises an entirely new question: should Must-have features be implemented first or should a product try to delight customers using Attractive features? Related work doesn't give an univocal answer to the question, which category of features should be prioritized when developing and designing products. The "official" way to go is Must-be > Performance > Attractive. Investing ressources in the development of Indifferent features is pointless since they don't influence the customer satisfaction. Features that are assigned the category "Reverse" should be subjected to further research since their opposite could be a Performance feature. Of course there are different influencing factors that need to be considered when prioritizing features in real life. Possible examples are time and money required to implement the feature, the question whether implementing an feature blocks the development of other features or the expected increase in profit resulting from the new feature. However the rule of thumb "all Must-be features have to be implemented and Attractive features help you stand out from the crowd" remains true.

References

  • [1]   Kano, "Attractive quality and must-be quality.", Hinshitsu (Quality, The Journal of Japanese Society for Quality Control) 14 (1984)
  • [2]   Walden, "Kano Introduction", Center for Quality of Management Journal (1993)
  • [3]   Pouliot, "Theoretical issues of Kano's methods.", Center for Quality of Management Journal 2.4 (1993)
  • [4]   Sauerwein, Bailom, Matzler & Hinterhuber: "The Kano model: How to delight your customers", International Working Seminar on Production Economics (1996)
  • [5]   Fong, "Using the self-stated importance questionnaire to interpret Kano questionnaire results.", The Center for Quality Management Journal 5.3 (1996)
  • [6]   DuMouchel, "Thoughts on graphical and continuous analysis." Center for Quality of Management Journal 2.2 (1993)

Run Kano studies online

Kano+ is a tool to create, run, and analyze Kano studies online and provide you with rich results to support your product decisions.
Create your Kano study now
Kano+ Logo

Kano+ is a tool to create, run, and analyze Kano studies online and provide you with rich results to support your product decisions.

Contact

© 2024 Kano+